
Message from Leadership
In a year marked by global challenges and transformative change, our commitment to a better world through positive change is steadfast. Sustainability remains one of the world’s toughest challenges.
This report captures a snapshot of 2025, the progress we have made, the projects we have delivered, and the metrics that reflect our dedication to continuous improvement.
Every effort contributes to a broader story that unfolds daily. Together, we’re turning ambition into action, building a more sustainable future through governance and measurable impact.
As we look ahead, we will focus beyond incremental improvements toward more transformative, sustained progress across our operations and client work. Over the past several years, we have implemented many practical measures to reduce our operational footprint. The next phase of our journey will require identification and advancement of step-change opportunities, whether through new technologies, deeper data insights, or broader engagement across our global offices.
We will continue to strengthen the quality of our data and ensure that our reporting reflects our performance. We will improve how we measure energy use, emissions, and resource consumption across regions, and align our methodologies to better support long-term decision-making and external expectations.
We’re building on the momentum of targeted initiatives and identifying additional opportunities to reduce scope 1 and 2 emissions, while advancing a clearer strategy for addressing our scope 3 footprint over time.
We invite you to explore this report and visit our website for ongoing updates, stories, and innovations that showcase our progress.

Jan Kwak
Managing Director,
Climate Change

Matthew Cramer
Managing Director,
Environment, People, and Place
Our progress
2025 highlights and achievements
Sustainability is the integration of economic performance, environmental stewardship, and community involvement for all stakeholders. Our focus remains on creating positive change for the communities we serve by developing innovative, practical solutions that deliver progress today and position future generations to thrive.
Environmental stewardship
We face real challenges that demand practical solutions and a credible plan. We’re deeply engaged in enhancing environmental performance in every aspect of our business, and we’re committed to transparent, accurate reporting of our sustainability metrics, supported by strong governance.
We align our activities with our sustainability policy, which outlines our commitment to environmental protection and pollution prevention, responsible resource use, social and community empowerment, and the integration of sustainability principles across our operations, projects, and supply chain.
Emissions reduction
Climate change continues to place growing pressure on ecosystems, economies, and communities worldwide. Responding effectively requires integrated strategies delivered at pace and scale. Leveraging the strength of our diverse teams, we combine technical excellence and commercial insight to design and implement practical, effective measures to reduce greenhouse gas (GHG) emissions and build climate resilience.
Our work is grounded in science and evidence, with a clear focus on solutions that deliver measurable value.
In 2020, we set a goal for net zero scope 1 and 2 emissions by 2030 and later expanded this commitment to include net zero scope 3 emissions by 2050. We evaluate our progress on the reduction of our absolute scope 1, 2, and 3 emissions and publicly disclose these figures in this report. We follow the GHG Protocol standards and guidance for the calculation of our global GHG inventories.
In 2025, we completed an updated assessment of our scope 1, 2, and 3 emissions. As in prior years, scope 3 emissions (primarily from employee commuting, business travel, and purchased goods and services) represented the largest share of our total footprint, reflecting the nature of our professional services operations.
Scope 1, 2 & 3 emissions reduction [tCO2e]
Compared with the previous reporting period (2023), our total GHG emissions have reduced by approximately 15%. This reduction reflects a combination of operational optimization, improved data quality, and targeted actions to reduce direct fuel use.
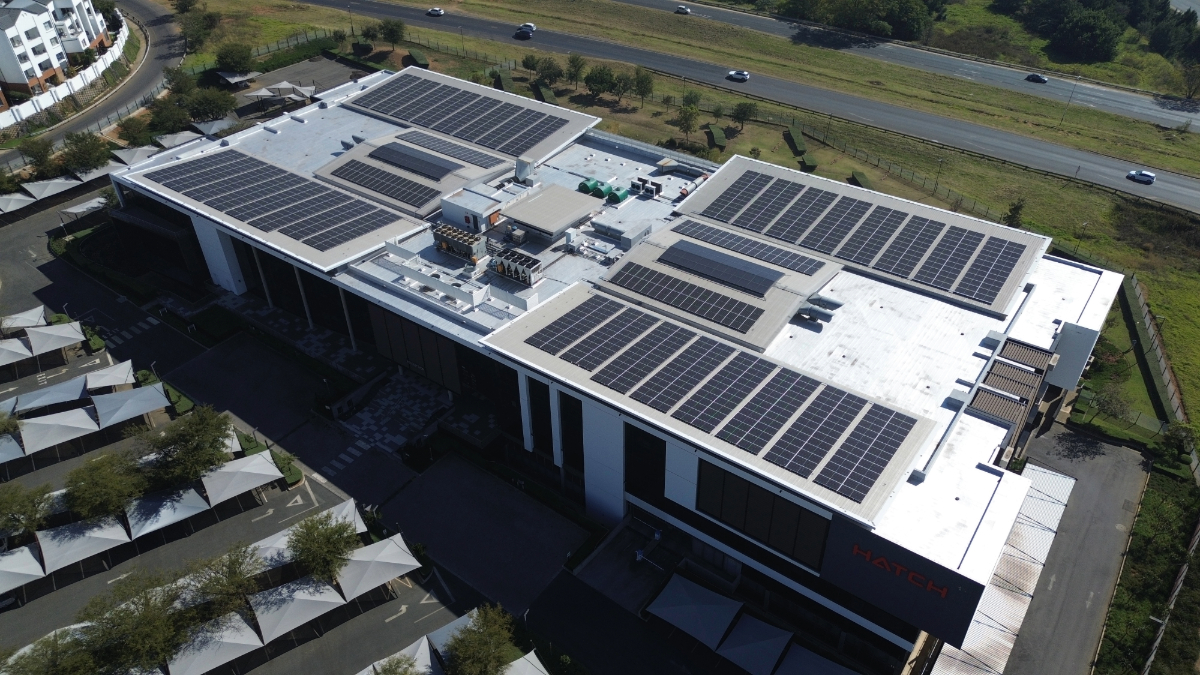
A key contributor to reduced scope 1 emissions was the significant decrease in stationary diesel use at our office in Johannesburg, South Africa. The installation of on-site solar panels reduced diesel fuel consumption for power generation by an estimated 95%, and 2025 marks the first year this emission benefit is fully reflected in our results.
Additional drivers influencing year-over-year changes include:
- Reduced fuel consumption from a smaller fleet of our owned and leased vehicles
- Lower overall energy and fuel inputs resulting from operational changes.
Our climate ambitions
While scope 3 emissions remain in our most material category, these results demonstrate measurable progress toward our 2030 net zero scope 1 and 2 targets. This also provides a clearer baseline for prioritizing future reduction strategies across energy use, fleet management, and supplier-related emissions. We’re developing a roadmap to address the most emissions-intensive subcategories.
Our net zero target includes a commitment to address ongoing residual emissions beyond our target date.
Additionally, through our client work, we support the transition to lower-carbon systems and more sustainable industries. These contributions represent a broader benefit to the communities and sectors we serve, distinct from our operational and value chain emissions footprint.
Environmental performance progress
In 2025, our environmental performance across energy, water, and resource use remained stable and largely optimized, reflecting the consistency of our office‑based operations and the effect of measures implemented in prior years. Across key indicators, we observed limited year‑over‑year variability, with performance generally holding steady at low levels of environmental impact relative to our footprint.
Energy efficiency
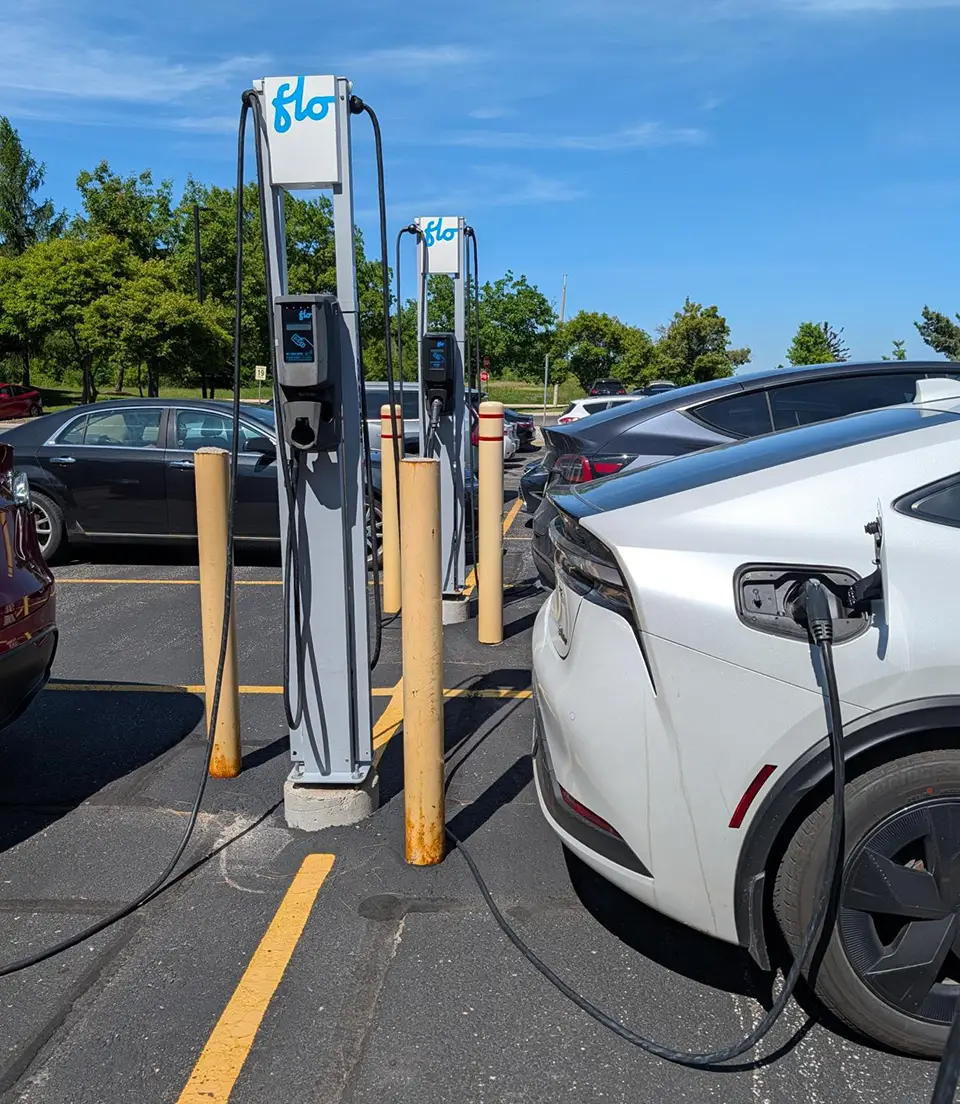
Across our global operations, we’re implementing initiatives that lower energy use and reduce GHG emissions at the facilities we own, driving measurable environmental progress.
Consumption trends remained broadly consistent, with electricity use decreasing slightly and natural gas consumption varying modestly due to external factors such as weather conditions rather than operational changes. Previous investments in building system upgrades and lighting retrofits continue to deliver ongoing efficiency benefits, with no significant additional gains to report, as these measures are now fully embedded in our operations.
This stability reflects the practical efficiency improvements already implemented within our existing office footprint. Now, we’re identifying longer-term, step-change opportunities to further reduce energy use and emissions.
Water use
Water consumption remains limited to standard office activities, sourced primarily from municipal systems. As a professional services organization, we don’t withdraw water from natural sources or use it in production processes, and our overall consumption is closely linked to employee occupancy levels.
Given our achieved results on this metric, we have shifted our focus to maintaining efficient building systems and responsible water use practices, including low-flow fixtures and automated controls.
Geographic coverage includes all owned offices in the Greater Toronto Area (GTA) covered under our ISO 14001 certification
* Headcount refers to the total number of full‑time equivalent employees
Resource use and biodiversity
Through innovative practices and partnerships, we work to preserve forests, protect biodiversity, and responsibly manage the use of resources.
Our waste generation remained relatively consistent with prior years, while waste diversion rates improved significantly, indicating better recovery and reduced landfill reliance. We’ve improved our ability to report total waste, attributable to updates in measurement methodologies following a change in waste service providers. We also continue to see progress in reducing material consumption, including ongoing declines in paper use driven by digital ways of working. While direct operational impact on biodiversity is limited due to our office-based footprint, our focus on reducing waste and improving diversion outcomes contributes to supporting broader ecosystem protection.
With many of the foundational efficiency measures already in place, future progress will depend on new approaches and broader engagement across our global operations, which will include employee-led initiatives and exploration of region-specific opportunities to achieve further environmental gains.
Geographic coverage includes all owned offices in the Greater Toronto Area (GTA) covered under our ISO 14001 certification
Governance and ethics
Guided by our Manifesto, our values, policies, and oversight drive everything we do. Our governance framework supports responsible decision-making and compliance across our global operations, bringing consistency to risk management.
We’re committed to clear, accurate, and timely disclosure of our sustainability performance, supported by responsible oversight for informed decision-making and continuous improvement across our global operations.
Social responsibility in action
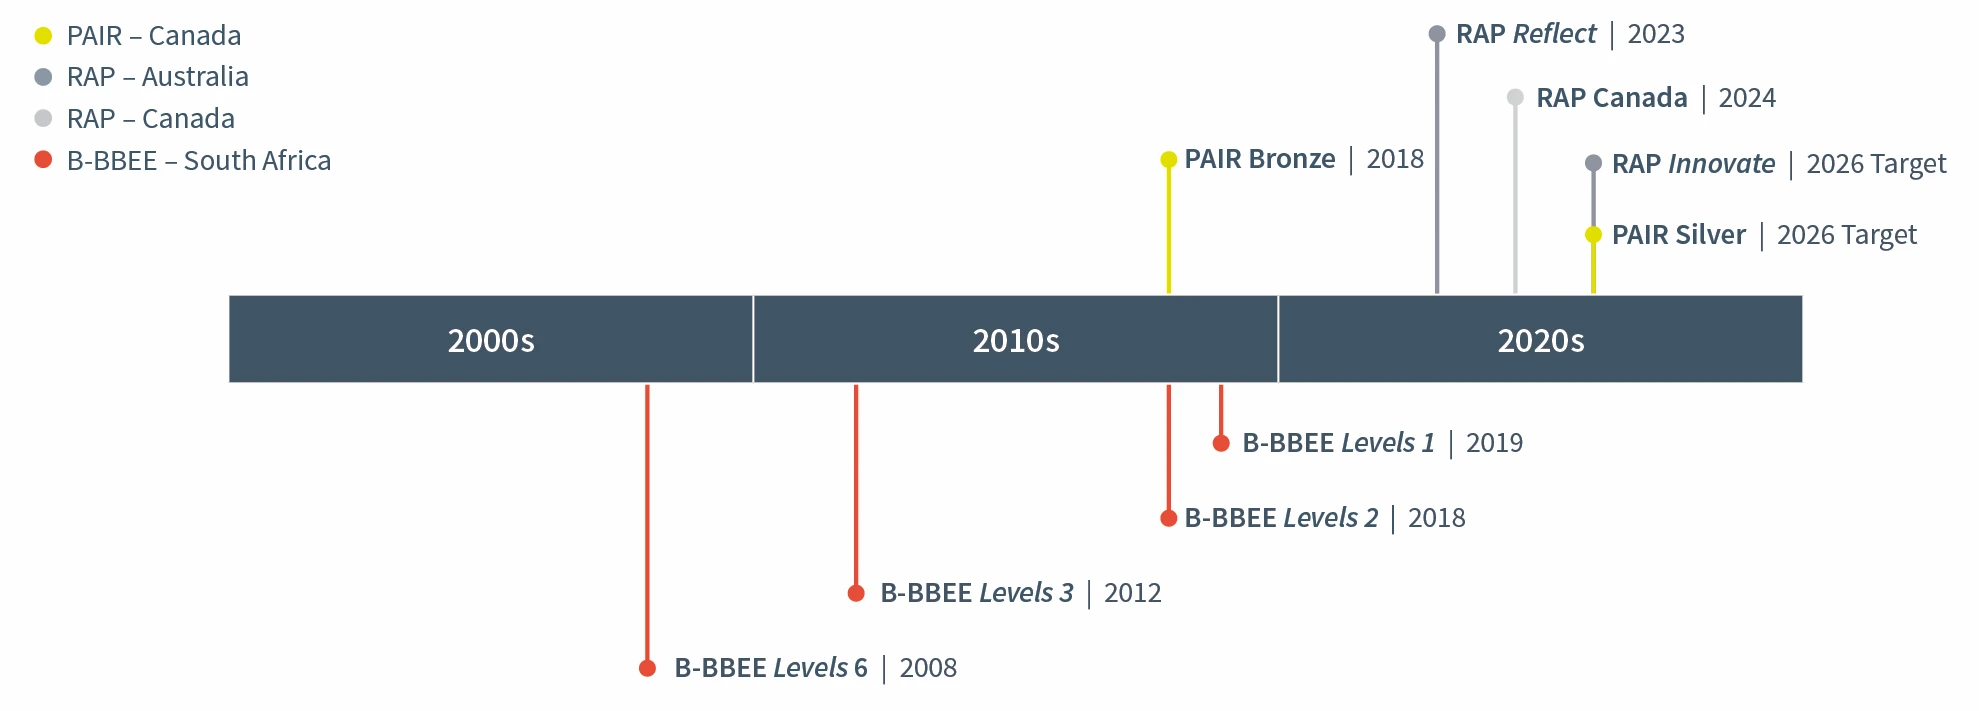
The Partnership Accreditation in Indigenous Relations (PAIR) measures how effectively a company builds and sustains meaningful relationships with Indigenous communities in Canada.
Bronze – establishing commitment and foundational policies
Silver – delivering measurable results in employment, procurement, and partnerships
Our focus: moving from intent to sustained, measurable impact.
Reconciliation Action Plan (RAP) frameworks guide how organizations advance reconciliation with First Nations and Indigenous Peoples in Australia and Canada. In Australia:
Reflect – building internal awareness and readiness
Innovate – taking action with clear targets and active partnerships
Our focus: embedding reconciliation into how we work, not just what we say.
Broad-Based Black Economic Empowerment (B-BBEE) measures a company’s contribution to economic inclusion across ownership, leadership, skills, and supply chains in South Africa.
Level 1 – Top-tier performance across ownership, leadership, skills development, and supply chain
Our focus: driving meaningful, system-wide inclusion at scale.
Community engagement
We recognize our responsibility to contribute positively to the communities where we live and work. Through meaningful engagement, we seek to understand local needs, build trust, and create shared value. Our approach reflects our commitment to long-term relationship building and to delivering social outcomes that extend beyond the projects we deliver.
As a global organization with a global operation, we recognize the importance of advancing reconciliation with Indigenous Peoples. For us, reconciliation is grounded in respect for First Nations and Indigenous rights, cultures, and knowledge systems, and in listening and learning. We engage meaningfully with First Nations, Inuit, Métis, Indigenous Peoples and communities, supporting economic participation and capacity building and creating space for their voices when projects are conceived and delivered.
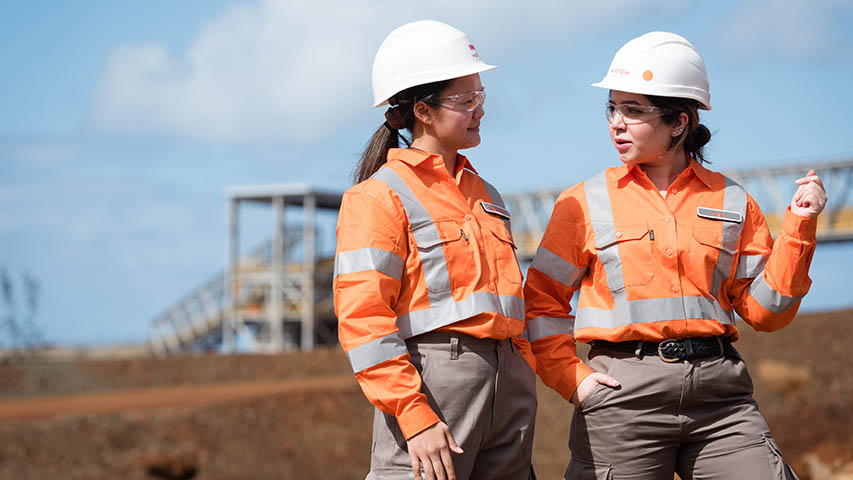
Diversity, equity, and inclusion
We believe diverse perspectives strengthen our business and the work we deliver. Through our commitment to diversity, equity, and inclusion, we create an environment where people feel valued and respected, empowered to contribute and grow. Guided by our values, we foster inclusive leadership and equitable opportunities grounded in a culture that values safety and belonging.
Percentage of women in organization
Percentage of management positions held by women
Since establishing a 2022 baseline, we have made measurable progress in gender diversity. The proportion of women has increased from 27% in 2022 to 34% in 2025, representing a 25% increase. Women’s representation in management has also strengthened over this period: the share of women within the management population rose from 23% to 28%, while the proportion of women employees holding a manager role increased from 5% to 7%, a 34% increase relative to the baseline. As part of this progress, women now represent 16% of our board of directors, up from no female representation in 2022.
Percentage of employees from a
minority or vulnerable group
We have also seen significant growth in the number of employees who voluntarily self-identify as belonging to minority groups. In 2025, 21% of employees self-identified as belonging to a minority group, compared with 11% in 2022, representing a 90% increase from the baseline. This trend reflects meaningful progress and reinforces the importance of our continued effort to improve inclusion, participation, and data quality across our global workforce.
Health and safety
Health and safety are fundamental to how we operate, and our global Health and Safety program promotes a collaborative culture with clear accountability at every level of the organization. Through a preventive and holistic approach, we work to protect the well-being of our employees, clients, suppliers, and contractors. Accountability for leading and implementing our health and safety policy sits with our CEO, senior leaders, and associates, reinforcing our Manifesto value of Achieving No Harm.
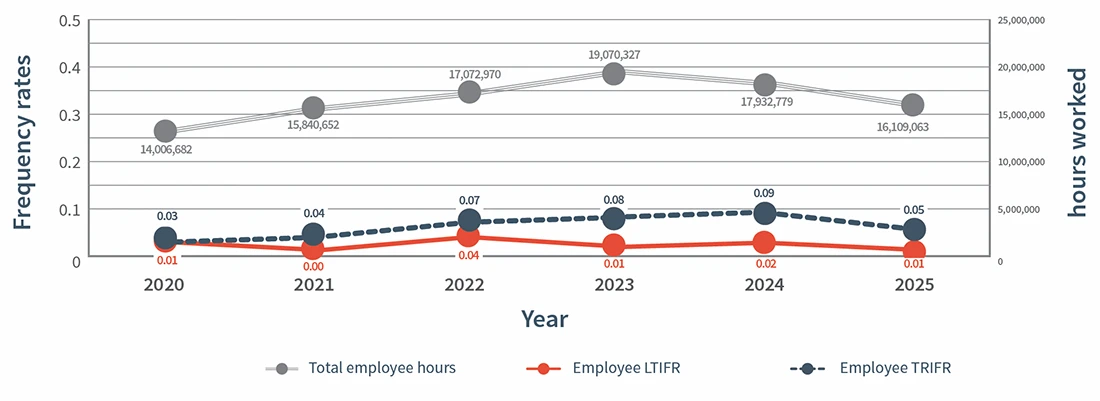
In 2025, we continued to demonstrate strong safety performance across our operations. Our total recordable injury frequency rate (TRIFR) was 0.05 for employees and 0.27 when employees and contractors are combined, substantially below typical industry benchmarks, which range from less than 1.2 in oil and gas and mining to less than 2.5 in construction. Our lost time injury frequency rate (LTIFR) remained consistently low at 0.02, both for employees alone and when contractors are included, compared with industry averages that can exceed 1.8 in construction.
These results reflect the effectiveness of our hazard identification, risk management, and safety leadership practices, and reinforce our commitment to maintaining safe, healthy workplaces. Safe construction sites not only protect our workforce on the job but have a lasting benefit beyond the project, ensuring our people return home healthy each day, strengthening families, and contributing to safer, more resilient communities.
Total recordable safety frequency rates
Our impact
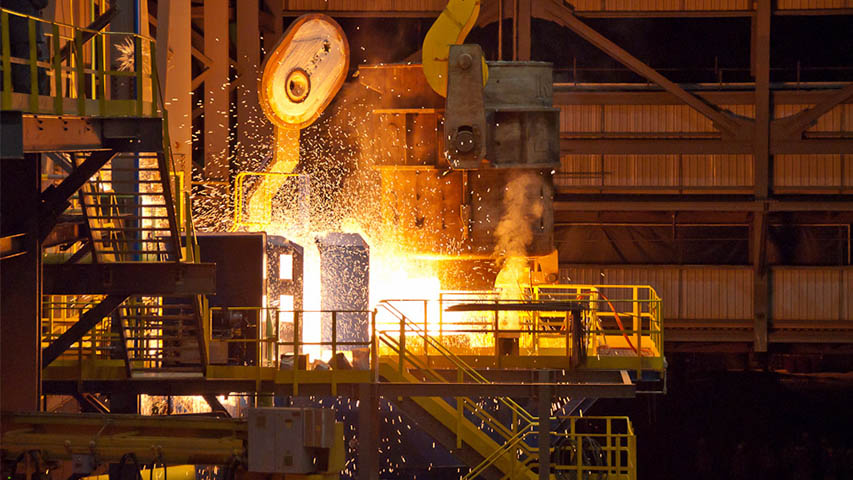
While we continue to improve our own operational footprint, our most significant contribution to sustainability and addressing climate change comes through the work we deliver with our clients. Across energy, infrastructure, and metals, we support the design and execution of decarbonization strategies, resilient infrastructure, energy optimization, and technologies that enable materially larger emissions reductions at scale.
We work alongside clients to define and deliver practical decarbonization roadmaps, translating long‑term climate ambitions into implementable projects that drive measurable outcomes.
Delivering positive change through project delivery excellence
We ensure that climate and environmental considerations are embedded from early concept through to project execution. By combining technical expertise with deep industrial and operational understanding, we help clients make decisions that balance performance, cost, and sustainability, resulting in solutions that are effective and durable over the long term.

Advancing innovation and technology
We contribute to climate progress by developing climate action plans, and then applying practical, innovative technologies and engineering solutions that support energy efficiency, electrification, process optimization, and low-carbon systems. Our role is often to bridge the gap between emerging technologies and real-world deployment, helping clients move from concept to implementation with confidence.
Enabling sustainable outcomes
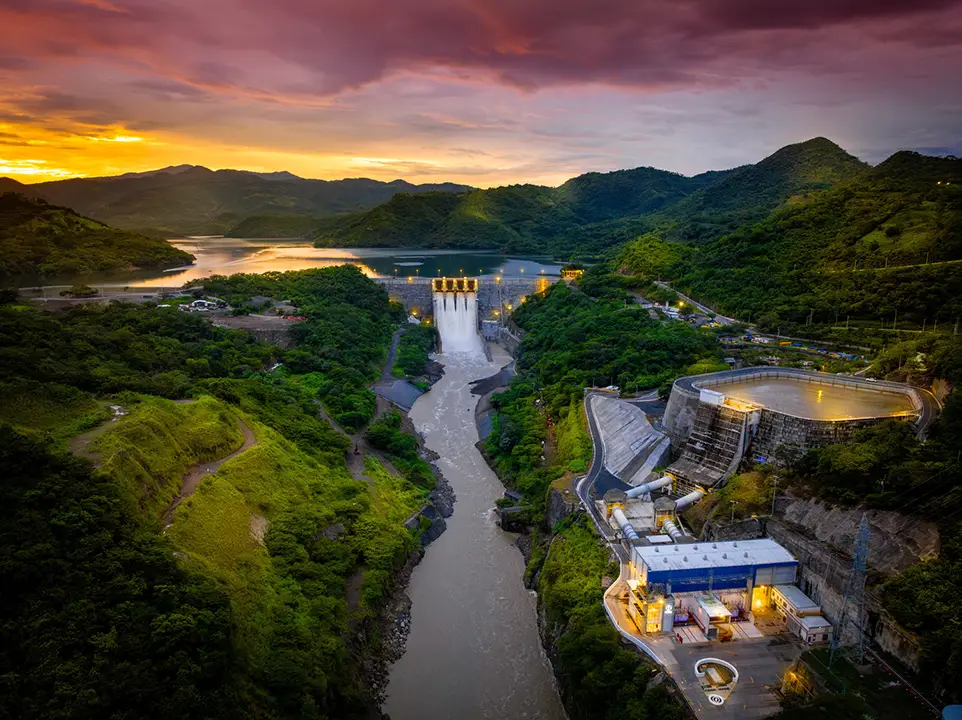
We enable effective outcomes leading to reduced energy use, lower emissions, improved resource efficiency, and more resilient infrastructure systems through projects that expand access to renewable energy, improve system reliability, and support communities in transitioning to more sustainable models of development.
Projects such as Wataynikaneyap Power and Newmont’s Yanacocha gold mine, along with other featured initiatives highlighted on our website, demonstrate how our capabilities translate into tangible environmental and social outcomes, and long-term benefits for communities.
Data tables
Year‑over‑year comparisons
- Climate change
- Empowering communities
- Environment
- Governance
- Health and safety
- Our people (and human rights)
Articles
Scaling decarbonization in Asia through shared carbon capture solutions
Turning energy risk into resilient, low‑carbon performance
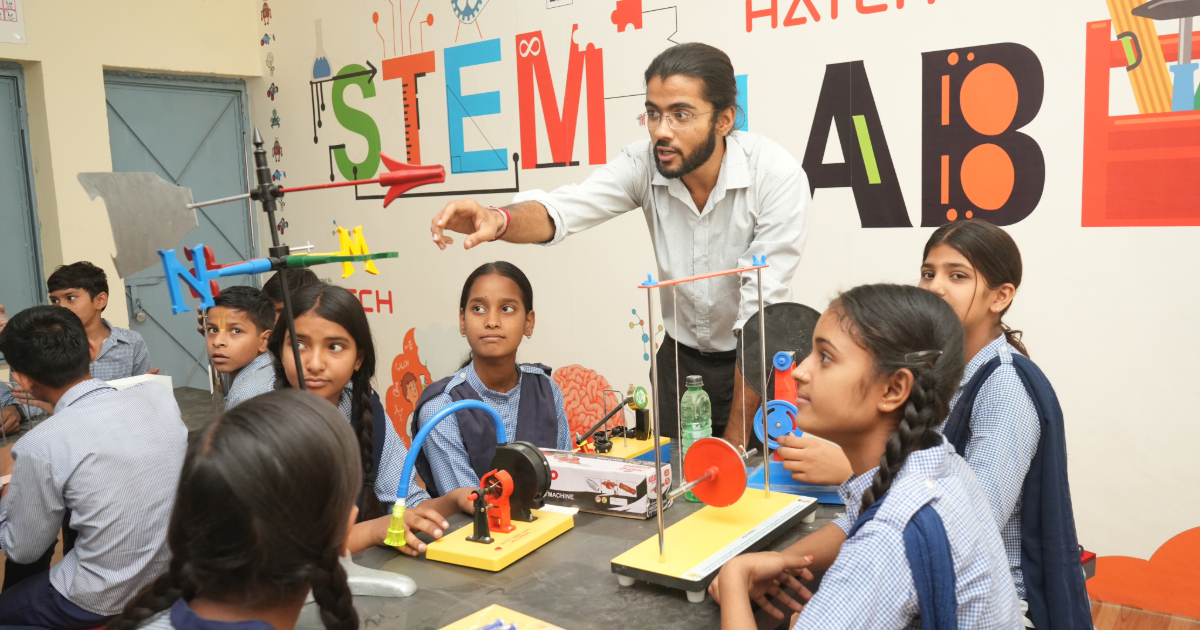
Advancing STEM education and livelihoods in India
The faster, the better? The intersection of rapid delivery and responsibility
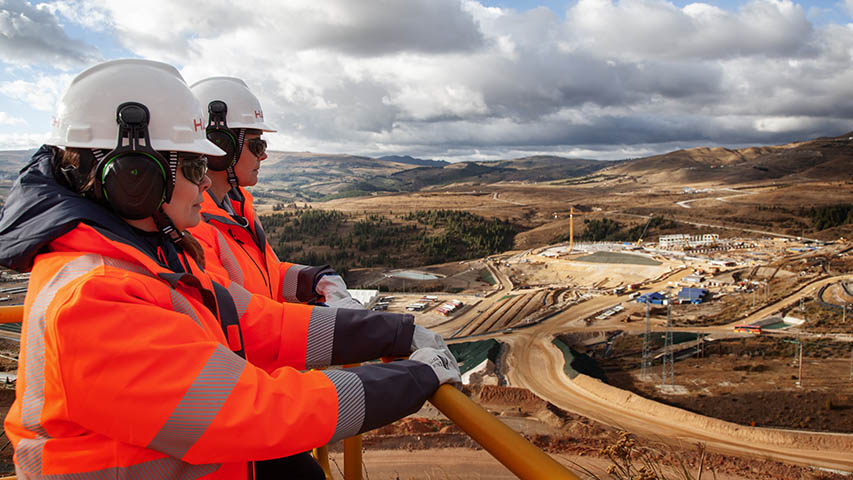
Newmont’s Yanacocha Water Transition Projects, a model for sustainable mine closure
Social responsibility
Our people and the communities we serve are central to how we do business. Through strong community engagement, a continued commitment to diversity, equity, and inclusion, and an unwavering focus on health and safety, we work to create environments where people feel respected, supported, and safe. These priorities guide how we collaborate with clients, partners, and communities, and how we look after one another, reinforcing our responsibility to deliver positive social outcomes wherever we operate.